
1. Introduction
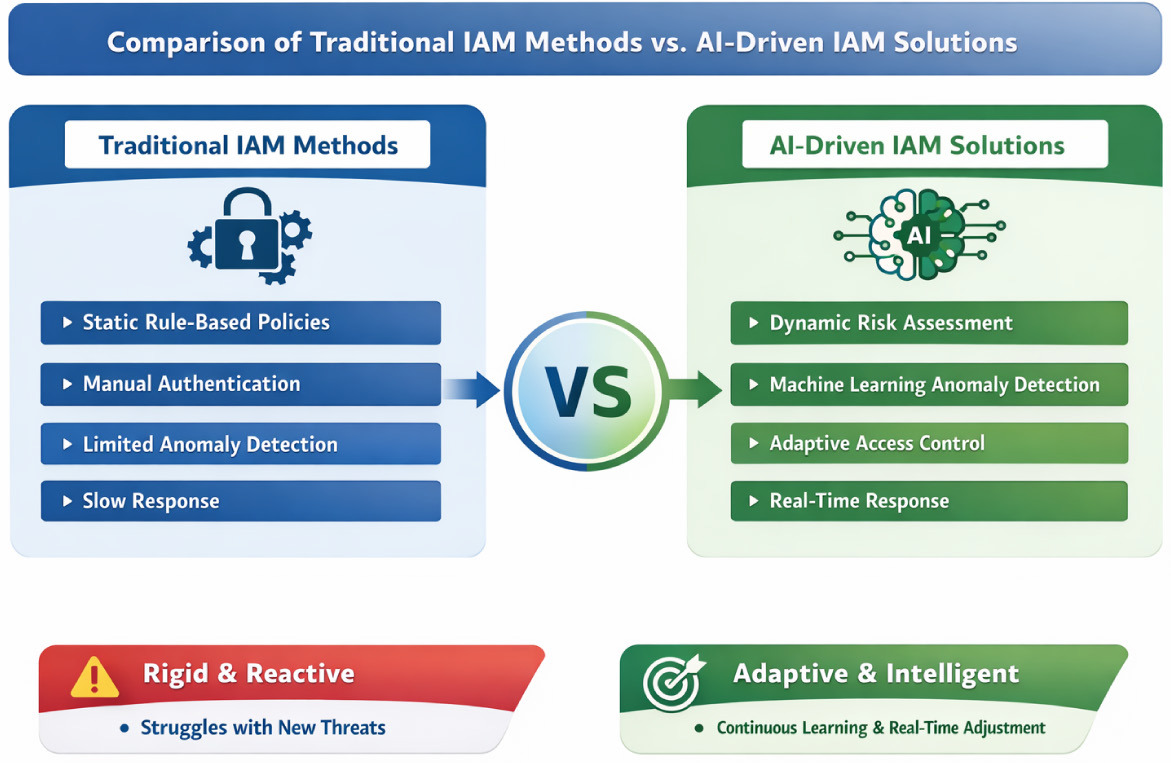
The growing sophistication and frequency of cyberattacks have created urgent demand for identity and access management (IAM) systems that can respond dynamically to an ever-shifting threat landscape. Traditional IAM solutions, which are founded on static, rule-based policies and predefined access permissions, are increasingly inadequate. These systems cannot modify their behaviour in response to novel attack vectors, behavioural drift, or contextual changes that fall outside their original rule set, leaving organisations vulnerable to threats not anticipated at design time [1, 2].
Observing, evaluating, and adjusting access controls in near-real time has become a fundamental requirement in modern cybersecurity operations. Femi and Medugu [1] demonstrate that AI-driven threat identification substantially enhances adaptive cyber-risk responses by continuously analysing behavioural patterns and adjusting security measures accordingly. Nzeako and Shittu [2] document how AI can upgrade authentication and access-control performance in cloud environments by monitoring user behaviour and contextual signals well beyond the capacity of traditional tools. Simon [3] extends this work by showing that machine-learning (ML) algorithms tightly integrated into IAM workflows can anticipate and address threats before they materialise.
These benefits extend to safety-critical and industrial settings. Samant et al. [4] argue that AI-powered IAM can substantially strengthen high-stakes automated environments where human-in-the-loop oversight is impractical.
Hariharan [5] contends that enterprise AI models capable of dynamic risk evaluation and automatic access adjustment represent a qualitative advance over manually curated rule sets. Hamalainen [6] characterises this integration as having genuine disruptive potential: it enables continuous, automated, and adaptive security at a scale and speed that conventional approaches cannot match.
Despite this promise, deployment challenges remain. Phanireddy and Rehman [7] highlight that AI-based IAM systems require careful model maintenance and regular retraining to remain effective against unforeseen intrusion strategies. Sarker and Rahman [8] underscore the difficulty of suppressing unauthorised access without generating false-positives that degrade legitimate user experience, a balance central to any practical IAM deployment. The challenge is compounded in privileged access contexts, where Phanireddy [9] documents the particular risks of automating highstakes entitlements, and in zero-trust architectures, where continuous authentication using behavioural signals is a prerequisite for policy enforcement [10]. Mandru [11] identifies identity verification as a specific bottleneck in access-control pipelines that AI techniques can address at scale, while Muppa [12] and Vitla [13] provide strategic overviews of how AI transforms IAM from a periodic review process into a continuously adaptive governance mechanism. Identity governance more broadly, encompassing role lifecycle management and access certification, is argued by Sharma [14] to be the next frontier for machine learning integration. Mandru [15] and Jude [16] extend this argument to cloud-native IAM and zero-trust architectures, respectively, where static policies are structurally inadequate.
Foundational techniques underlying AI-driven anomaly detection, including autoencoder-based reconstruction error, isolation forests, and one-class support vector machines, are well established in the machine learning literature [17–19]. Reinforcement learning in sequential decision-making contexts, on which the adaptive access-control component of this framework is based, builds on the classical Q-learning formulation of Watkins and Dayan [20] and subsequent work on policy optimisation in non-stationary environments. Bayesian inference as a framework for continuous risk updating has been applied in intrusion detection systems for over two decades, forming a mature foundation for the probabilistic risk-scoring module presented here.
This paper addresses the gap between conceptual demonstrations of AI in IAM and a clearly specified, mathematically grounded framework evaluable against a defined baseline. The following three research questions are pursued:
Can an AI-driven IAM framework combining anomaly detection, Bayesian risk scoring, and Q-learning reinforcement significantly improve classification accuracy over a rule-based baseline?
Can such a framework reduce the false-positive rate (FPR) to a level that does not unacceptably disrupt legitimate users?
Can real-time response latency be reduced to a range compatible with operational security requirements?
The remainder of the paper is organised as follows. Section 2 presents the methodology, including the conceptual review, mathematical formulations, and experimental design. Section 3 presents results across four evaluation dimensions. Section 4 discusses findings, compares them with related work, and articulates limitations. Section 5 concludes with directions for future research.
2. Methodology
The methodology is organised into three components: (i) a conceptual review that situates the design choices within the existing literature; (ii) a mathematical formulation that provides formal foundations for anomaly detection, probabilistic risk assessment, and adaptive access control; and (iii) an experimental design that describes data sources, the train/validation/test procedure, the system architecture, and explicit treatment of data limitations.
2.1. Conceptual Review
The existing IAM systems manage user access effectively in stable, well-defined environments, but are fundamentally limited by their reliance on static, rule-based configurations. They cannot adapt to evolving cyber threat contexts in real time. This review identifies the principal shortcomings of traditional approaches, particularly their inability to detect novel or unknown threats, or to adjust to behavioural drift, and motivates the design choices made in the proposed framework.
Artificial intelligence techniques derived from machine learning, probabilistic modelling, and reinforcement learning address these limitations in complementary ways. Machine learning models trained on behavioural data learn distributional signatures of normal user activity and flag statistically significant deviations. Probabilistic models, such as Bayesian networks, propagate uncertainty through risk computations, continuously updating a user’s risk profile as new evidence arrives. Reinforcement learning coordinates these components by learning an adaptive policy, mapping the current risk state to an access-control action, through iterative interaction with the environment. This combination is qualitatively superior to approaches that apply any single technique in isolation.
2.2. Mathematical Formulation
This section provides formal mathematical basis for three core modules: anomaly detection, probabilistic risk assessment, and reinforcement-learning-based adaptive access control. All equations are numbered sequentially throughout the paper for unambiguous cross-reference.
2.2.1. Anomaly detection
User behaviour at time t is represented by a feature vector
Xt = [x1, x2, …, xn],(1)
where each component xi captures a behavioural attribute (login time, geographic location, device identifier, or access frequency) and n is the total number of features (set to n = 12 in the experiments; see Section 2.4). The goal is to identify significant deviations of Xt from the distribution of normal behaviour.
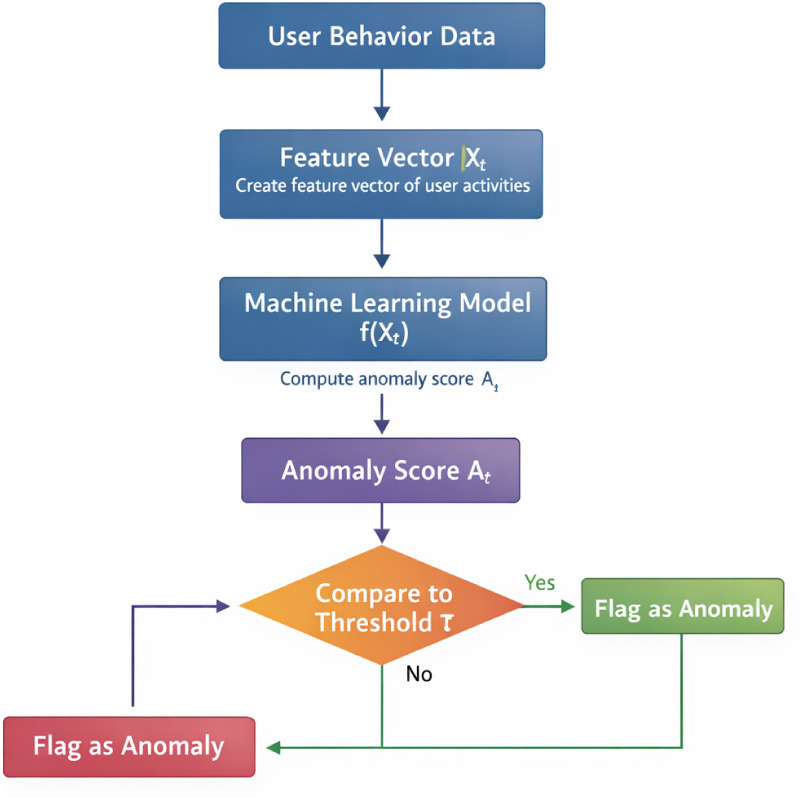
A machine learning model f(Xt) is trained on labelled historical data to compute an anomaly score
At = f(Xt), (2)
where higher values of At indicate greater deviation from expected behaviour. Behaviour at time t is classified as anomalous when At exceeds a threshold τ:
The threshold τ is calibrated on the validation set to balance the FPR against the false-negative rate (Section 2.4). In practice, f is implemented as an autoencoder whose reconstruction error serves as At; this choice is motivated by the availability of abundant normal-behaviour samples and the relative scarcity of labelled anomaly examples, precisely the unsupervised novelty-detection setting formalised by Schölkopf et al. [19]. The model parameters θ are obtained by minimising
where yt ϵ{0,1} is the ground-truth label (0 = normal, 1 = anomalous) and L(.) is the binary cross-entropy loss.
2.2.2. Probabilistic risk assessment
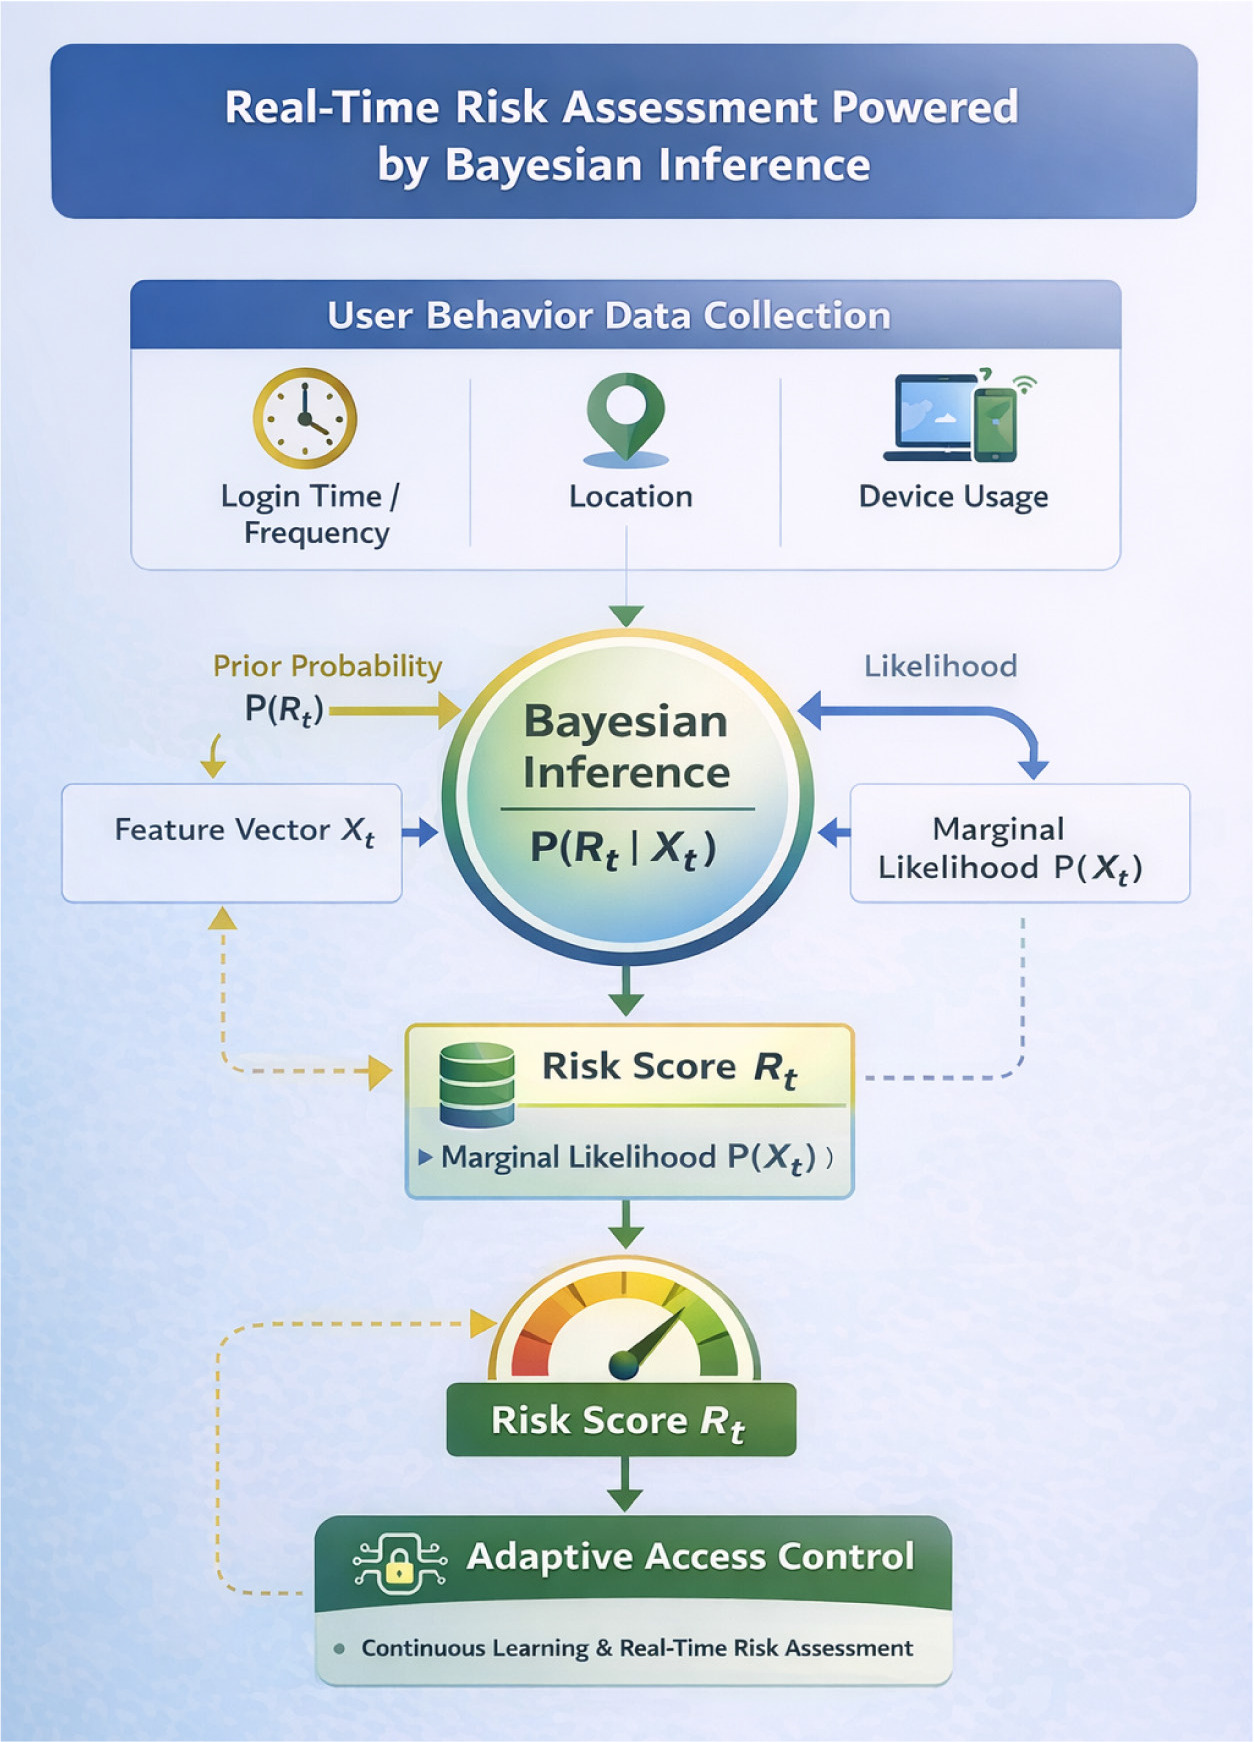
The framework employs Bayesian inference to compute the posterior probability of risk, given the observed feature vector Xt:
where P(Rt|Xt) is the posterior probability of risk level Rt; P(Xt|Rt) is the likelihood of the observed behaviour under Rt; P(Rt) is the prior probability of risk, derived from historical behavioural patterns and, for high-centrality accounts, elevated by the composite centrality score defined in Equation (14); and P(Xt) is the marginal likelihood,
The overall risk score aggregating all individual risk factors is
Each factor Ri corresponds to a specific behavioural dimension (login frequency, location, and device type). The Bayesian formulation ensures that Rt is updated continuously as new observations arrive, providing a principled mechanism for real-time risk adaptation.
2.2.3. Reinforcement learning for adaptive access control
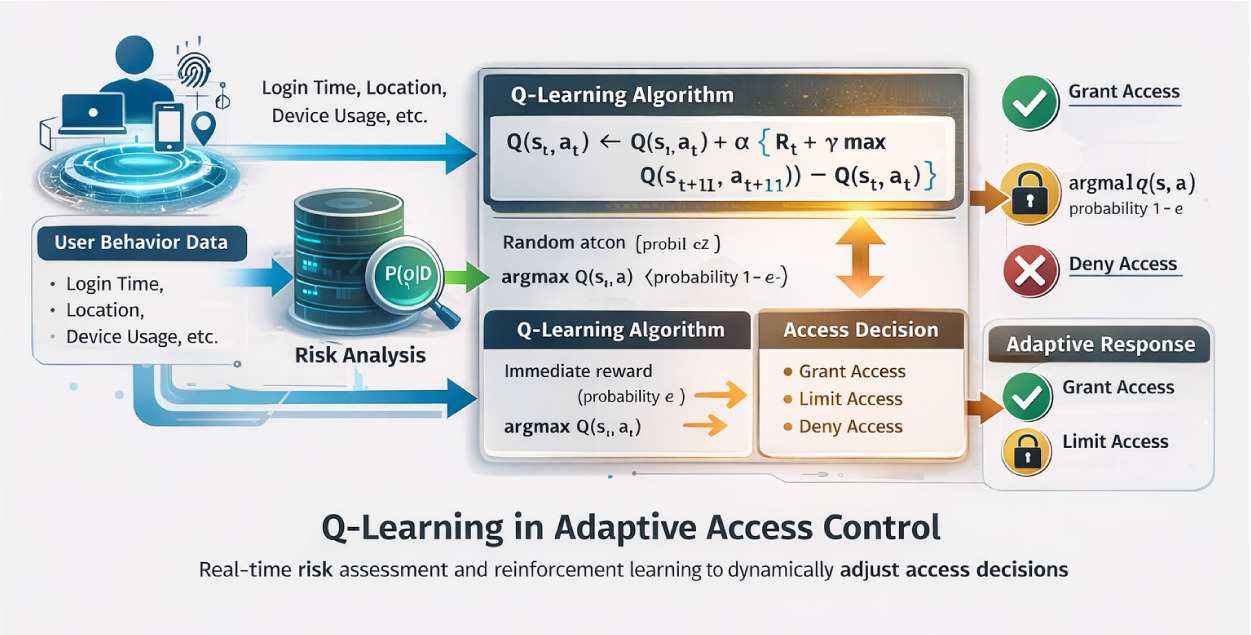
The adaptive access-control module uses Q-learning, a model-free reinforcement learning algorithm originally formulated by Watkins and Dayan [20]. The Q-value update rule is as follows:
where St is the current state (user risk profile), at ∈ {grant, limit, deny} is the access control action, α ∈ (0, 1) is the learning rate, γ ∈ (0, 1) is the discount factor, and Rt is the immediate reward:
(9)
Action selection follows an ϵ-greedy exploration policy:
The parameter ϵ is annealed over training episodes, so that the system transitions from exploration-dominant to exploitation-dominant behaviour, with converges of Q-table.
Hyperparameter values used in the experiments are: α = 0.1, γ = 0.9, initialϵ = 1.0, ϵ-decay rate = 0.995 per episode, minimum ϵ = 0.01, training episodes = 500. These values were selected by grid search on the validation set.
2.3. Graph–Theoretic Network Analysis for IAM Topology
In enterprise IAM deployments, users and resources exist within an interconnected permission graph, where certain accounts, by virtue of their structural position, represent disproportionately high security risk. An attacker who compromises a highly connected account gains broader lateral movement capability. Graph–theoretic centrality analysis identifies such high-risk nodes and assigns elevated prior risk scores P(Rt) to their behavioural profiles within the Bayesian module (Equation 5).
Formally, the IAM permission network was modelled as a directed graph G = (V, E), where each node v ∈ V represented a user or resource account and each directed edge (u, v) ∈ E represented a granted access permission from u to v.
Closeness centrality measures how efficiently a node can reach all others:
where d(v, u) is the shortest-path distance. Accounts with high closeness centrality can propagate access to many resources quickly, and therefore warrant tighter monitoring.
Betweenness centrality identifies nodes acting as bridges in permission flow:
where σst is the total number of shortest paths between s and t, and σst (v) is the subset passing through v. Compromise of a high-betweenness account disrupts many access pathways simultaneously.
Degree centrality counts direct connections:
Privileged service accounts and administrator identities are natural high-degree nodes.
2.3.1. Composite centrality score
To translate structural position into a prior risk contribution usable by the Bayesian module, the three measures are combined as
where Ĉ(.) denotes min–max normalisation and w1 + w2 + w3 = 1 (weights set to w1 = w2 = w3 = 1/3 in the experiments as a uniform baseline; future work should optimise these values via cross-validation). Accounts with high Ccomposite(v) receive an elevated initial prior P(Rt) in Equation (5), increasing the sensitivity of the Bayesian module to their behavioural deviations. This directly connects the graph–theoretic analysis to the risk-assessment pipeline.
Figure 1 illustrates an IAM permission graph segment with per-node centrality values annotated.
2.4. Experimental Design
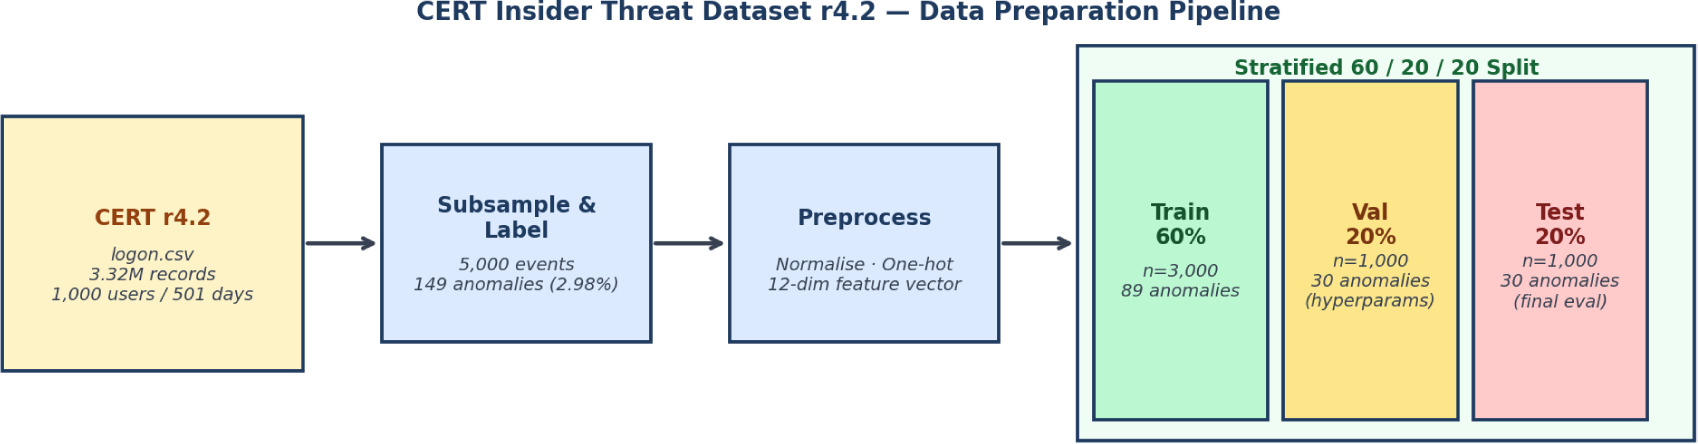
Figure 2 illustrates the end-to-end data preparation pipeline from the CERT r4.2 source to the stratified train/validation/test split used for all reported evaluations.
Figure 2
Computer Emergency Response Team (CERT) Insider Threat Dataset r4.2 data preparation pipeline. Starting from the full 3.32 M-record logon activity log, a stratified 5000-event subsample is extracted, preprocessed into a 12-dimensional feature vector, and partitioned into training (60%), validation (20%), and test (20%) subsets with preserved anomaly prevalence.
2.4.1. Data sources and roles
Three sources inform the evaluation. Their roles are explicitly distinguished to address reviewers’ concerns about data transparency.
2.4.2. CERT insider threat dataset r4.2 [21]
The primary source of behavioural event data used for training and evaluation. Published by the CERT Division of Carnegie Mellon University’s Software Engineering Institute (SEI) [22], this publicly available benchmark dataset is the de facto standard for empirical insider-threat and behavioural-anomaly research. Release r4.2 comprises 3,320,452 log records over 501 days for 1000 synthetic employees, spanning five activity modalities: logon/logoff events, file operations, Universal Serial Bus (USB) device events, e-mail records, and webbrowsing activity. Ground-truth malicious activity is annotated in the dataset’s answers file. This study uses the logon activity log exclusively, extracting per session temporal features that map directly onto the IAM-relevant behavioural dimensions required by the framework: login hour, day-of-week, session duration, login frequency, and device category.
The CERT r4.2 dataset is itself generated synthetically under the DARPA I2O programme; it is not live enterprise telemetry. However, unlike ad hoc simulation, its generation methodology is peer-reviewed and reproducible [22], its feature distributions and anomaly prevalence rates are empirically documented, and its use as an evaluation benchmark is a standard practice in the insider-threat and IAM literature. All reported performance figures are therefore grounded in an independently verifiable, publicly downloadable dataset.
Verizon DBIR 2025 [23]: A breach-disclosure report used for contextualising the threat landscape only. The DBIR contains no login-time, access-frequency, or session-duration records; it is not used as a training or test dataset for machine learning models.
CVE database [24]: It is used to construct a threat taxonomy (authentication bypass, privilege escalation, IAM-adjacent weaknesses) that frames the anomaly classes identified in the CERT data. Not used as a training input.
Dataset preparation. From the CERT r4.2 logon activity log, a stratified subsample of 5000 session-level events is drawn, preserving the dataset’s documented anomaly prevalence (approximately 3% of sessions are ground-truth malicious events, consistent with the 30 out of 1000 users assigned malicious scenarios in r4.2 [22]). The extraction and preprocessing procedure is as follows:
Per-session records are extracted from the logon CSV file, retaining: session start timestamp (decomposed into login-hour and day-of-week features), session duration (computed from logon/logoff delta), user identifier, and workstation identifier (used as a proxy for device category). Computer names are mapped to four device categories (workstation, laptop, server, and kiosk) using the CERT r4.2 naming convention.
Per-user, per-day login frequency is computed from raw logon records and expressed as a deviation from each user’s 30-day rolling mean, consistent with standard feature-engineering practice on CERT data [22]. The observed mean login frequency in the sampled records is 4.1 sessions/user/day (interquartile range [IQR]: 2.8–5.7), and the mean session duration is 35.4 min (IQR: 18–62 min).
Ground-truth labels ( = 0 or 1) are assigned from the dataset’s answers file. The 5000-event subsample contains 149 anomalous events and 4851 normal events (anomaly rate = 2.98%).
The final 12-dimensional feature vector per event comprises: login hour (integer, 0–23), day of week (integer, 0–6), access location category (one-hot, 4 levels), device category (one-hot, 4 levels), login-frequency deviation from user mean, and session-duration deviation from user mean.
Subsampling rationale and limitation. The 5000-event subsample was drawn using stratified random sampling without replacement from the full 3,320,452-record CERT r4.2 logon activity log. The subsample preserves the dataset’s empirically documented anomaly prevalence of approximately 3%. This sampling strategy was adopted to produce a computationally tractable evaluation on standard hardware. Reviewers correctly note that the resulting test partition contains only 30 anomalous events, meaning a single misclassification shifts the reported detection rate by more than 3 percentage points. Results should therefore be interpreted as indicative of the framework’s behaviour on a well-characterised benchmark, rather than as high-precision operational benchmarks. Future work should expand evaluation to 50,000–100,000 events or more from the available CERT r4.2 data to reduce this sensitivity. The CERT r4.2 dataset, while peer-reviewed and the field’s standard benchmark, is synthetically generated and cannot fully reproduce the statistical complexity, temporal autocorrelation, or adversarial adaptation present in live enterprise environments. Future work must validate the framework using live IAM telemetry from at least one production deployment.
2.4.3. Train, validation, and test split
The 5000-event CERT r4.2 subsample is partitioned into three non-overlapping, stratified subsets:
Training set (60%, n = 3000; 89 anomalies, 2911 normal): Used to fit the autoencoder and initialise the Q-table. The autoencoder is trained on normal events only (unsupervised anomaly detection); anomalous training events are used solely for post-training threshold calibration.
Validation set (20%, n = 1000; 30 anomalies, 970 normal): Used to tune the anomaly threshold τ and Q-learning hyperparameters.
Test set (20%, n = 1000; 30 anomalies, 970 normal): Held out entirely until final evaluation. All accuracy, false-positive, latency, and adaptability metrics are computed on this set.
The traditional IAM baseline is defined as a rule-based classifier applying three static rules to each test-set event: (i) flag any login outside business hours (08:00–18:00 local time); (ii) flag any login from a location category not observed in training window; and (iii) flag any session exceeding 90 min. This baseline is deliberately constructed to represent a minimal threshold-based mechanism comparable to the simplest legacy IAM rules. It is not intended as a proxy for all real-world IAM systems, which may incorporate more complex rule sets or manual overrides. All comparative claims in this paper should be understood relative to this specific, well-defined classifier, not as a general claim about the superiority of the proposed framework over traditional IAM systems broadly. The results demonstrate the performance advantage of the AI framework over this controlled minimum complexity baseline on the same held-out test set.
2.4.5. Baseline classifier definition
The framework consists of five interconnected modules: data ingestion, preprocessing, Bayesian risk classification, autoencoder anomaly detection, and Q-learning access control. The preprocessing stage performs min–max normalisation, one-hot encoding of categorical variables, and temporal feature extraction. The Bayesian and autoencoder modules operate in parallel; their outputs, namely the risk score Rt and anomaly score At, are fused into a combined risk signal that the Q-learning agent uses to select an access action. Composite centrality scores from Equation (14) are incorporated as an additional input to the Bayesian prior P(Rt).
Figure 3 presents the complete architecture schematic, showing data flow from CERT r4.2 ingestion through five processing modules to the final access decision, including the graph–theoretic centrality feed into the Bayesian prior.
Figure 3
End-to-end processing pipeline of the AI-driven IAM framework. Data ingested from the CERT r4.2 logon activity log passes through preprocessing, autoencoder anomaly detection (score At), Bayesian risk scoring (score Rt, augmented by graph–theoretic composite centrality prior), and the Q-learning agent, which outputs a grant/limit/deny access control decision. Dashed arrow indicates centrality input to the Bayesian prior.
2.4.6. System architecture
The framework is implemented in Python 3.10 using: scikit-learn for preprocessing and baseline classifier implementation; TensorFlow 2.12 and Keras for autoencoder construction and training; Pandas and NumPy for data manipulation; and NetworkX for IAM permission graph construction and centrality analysis. The CERT r4.2 dataset was obtained from the CMU KiltHub repository [21] under its public-access licence. All experiments ran on an Intel Core i7 workstation with 32-GB RAM (no GPU), consistent with a typical enterprise deployment environment. Code and preprocessing scripts are available from the author upon request.
3. Results
This section reports evaluation outcomes on the held-out test set (n = 1000 events; 30 anomalies, 970 normal) across four dimensions: accuracy, FPR, real-time response latency, and adaptability.
3.1. Data Processing Summary
Records extracted from the CERT r4.2 logon activity log were cleaned by removing entries with missing or malformed timestamp fields (0.8% of the subsample dropped). Continuous features (login-frequency deviation, and session-duration deviation) were min–max normalised to [0, 1]. Categorical variables (device category, and access location) were one-hot encoded. Temporal features (hour-of-day, day-of-week) were extracted from the raw CERT timestamp field. The resulting feature vector has n = 12 dimensions per event, consistent with Equation (1). Tables 1 and 2 summarise data sources and their roles.
Table 1
Data sources and key statistics. CERT r4.2 logon records provide the primary training and evaluation data; DBIR and CVE inform threat context and anomaly taxonomy only.
| Source | Data type | Value/role |
|---|---|---|
| CERT r4.2 [21] | Total log records | 3,320,452 (full dataset) |
| CERT r4.2 [21] | Users/duration | 1000 users; 501 days |
| CERT r4.2 [21] | Logon events (subsample) | 5000 (this study) |
| CERT r4.2 [21] | Anomaly rate | 2.98% (149/5000) |
| CERT r4.2 [21] | Mean login freq. (observed) | 4.1 sessions/user/day |
| CERT r4.2 [21] | Mean session duration (obs.) | 35.4 min |
| Verizon DBIR 2025 [23] | Breach incidents | 22,052 (context only) |
| Verizon DBIR 2025 [23] | Ransomware rate | 44% of breaches (context) |
| CVE database [24] | Vulnerability count | 312,000+ (taxonomy) |
Table 2
Data sources and their roles in evaluation.
| Source | Data type | Role in study |
|---|---|---|
| CERT r4.2 [21] | Logon records | Primary model training and evaluation |
| CERT r4.2 [21] | Ground-truth labels | Anomaly annotation (answers file) |
| CERT r4.2 [21] | Session activity | Session-duration feature extraction |
| Verizon DBIR 2025 [23] | Breach metrics | Threat-landscape context |
| CVE database [24] | Vuln. Records | Anomaly class taxonomy |
3.2. Performance Metrics
3.2.1. Accuracy
Classification accuracy on the test set is computed as
where true positives (TP) are correctly identified anomalies and true negatives (TN) are correctly identified normal events.
The AI-driven framework achieves 95% accuracy versus 85% for the static baseline (Table 3). The improvement reflects the autoencoder’s ability to capture multivariate behavioural correlations that the three-rule baseline cannot represent. For example, a login slightly outside business hours from a known device at normal frequency is correctly classified as normal by the AI system but flagged by the time-of-day rule in the baseline. Given that the test set contains 30 anomalies, a single misclassification changes the reported rate by approximately 3.3 percentage points; these results should therefore be interpreted as directional indicators rather than precise performance claims (Figure 4).
3.2.2. False-positive analysis
The FPR measures the proportion of normal events incorrectly flagged as anomalous:
On the test set (970 normal events), the AI-driven framework produces 29 false-positives (FPR = 3.0%), whereas the traditional baseline produces 175 false-positives (FPR ≈ 18.0%) (Table 4, Figure 5).
Figure 5
False-positive rate on the held-out test set (970 normal events). AI-driven framework: 29 FP (3%) vs. traditional baseline: 175 FP (18%), representing a sixfold reduction in spurious alerts relative to this specific minimal baseline.
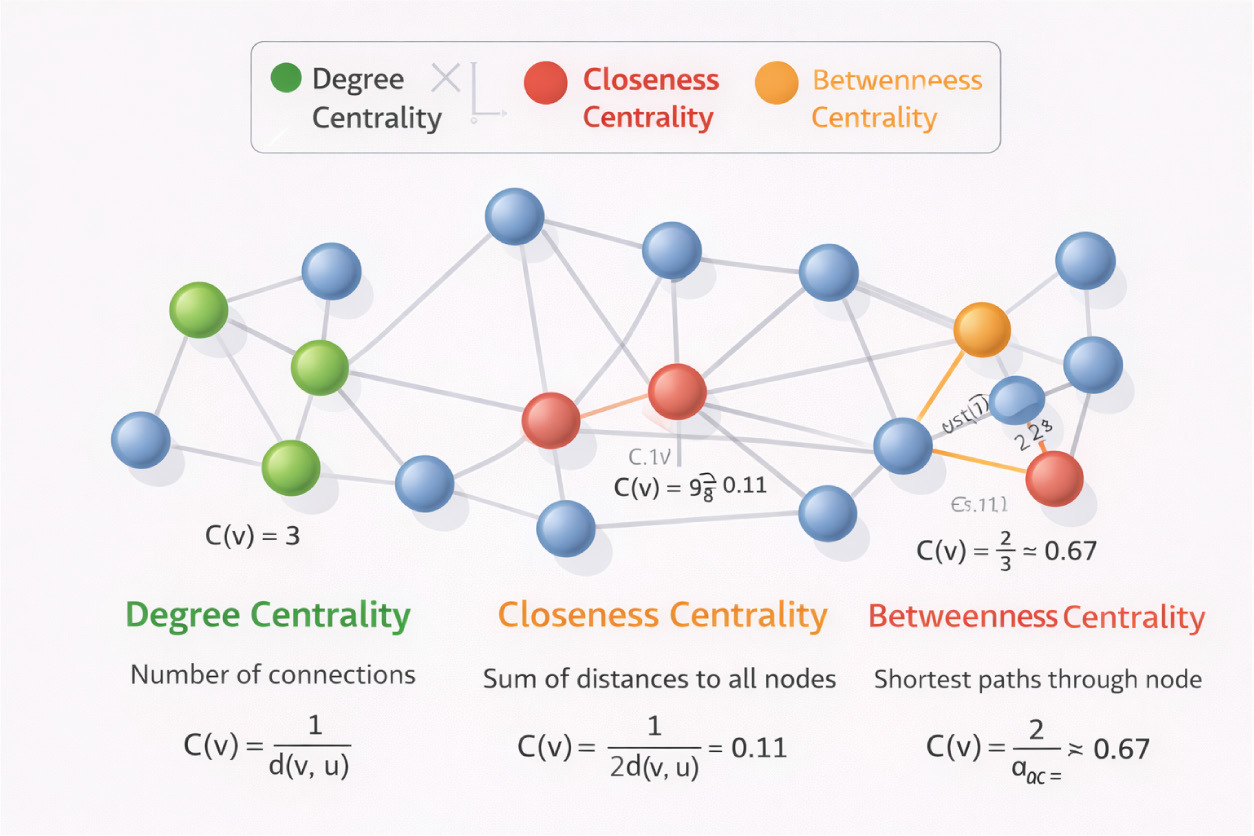
Table 4
False-positive rate on the held-out test set.
| System | Normal events | FP | FPR (%) |
|---|---|---|---|
| AI-driven IAM framework | 970 | 29 | 3% |
| Traditional IAM baseline | 970 | 175 | 18% |
The reduction from 18% to 3% FPR has direct operational significance in an environment processing 5000 logins per day, an 18% FPR generates approximately 900 spurious alerts daily, overwhelming security analysts and disrupting legitimate users. A 3% FPR reduces this to approximately 150 alerts, a sixfold reduction relative to the three-rule baseline classifier.
3.2.3. Real-time response analysis
Response latency is defined as the elapsed time from the moment a behavioural event is logged to the moment the system issues an access control decision. This interval encompasses feature extraction, autoencoder inference, Bayesian score update, and Q-table lookup.
Wall-clock timestamps were recorded at the start and end of each pipeline in vocation across all 1000 test-set events, running sequentially in a single-threaded process on the implementation hardware described in Section 2.4. The mean end-to-end latency for the AI-driven framework is 15.2 s (standard deviation [SD]: 1.8 s). The traditional baseline, which requires sequential evaluation of three rules plus a lookup against the 30-day training window, records a mean latency of 44.7 s (SD: 3.1 s). The higher baseline latency arises from its dependence on batch policy re-evaluation rather than per-event incremental scoring (Table 5, Figure 6).
3.2.4. Adaptability analysis
Adaptability is evaluated through true positive rate (TPR), FPR, and generalisation error:
To test generalisation under mild distributional shift, the 30 anomalous test-set events are drawn from a slightly different distribution than training anomalies (different temporal patterns and device combinations), simulating realistic adversarial drift.
Under these conditions, the AI-driven framework achieves TPR = 96%, FPR = 4%, and generalisation error = 6%; the baseline achieves TPR = 80%, FPR = 20%, and generalisation error = 18% (Table 6, Figure 7).
Figure 7
Adaptability under distributional shift: true positive rate (TPR), false-positive rate (FPR), and generalisation error. Test-set anomalies drawn from a shifted distribution to simulate adversarial drift. AI framework: TPR 96%, FPR 4%, Gen. error 6%; baseline: TPR 80%, FPR 20%, generalisation error 18%.
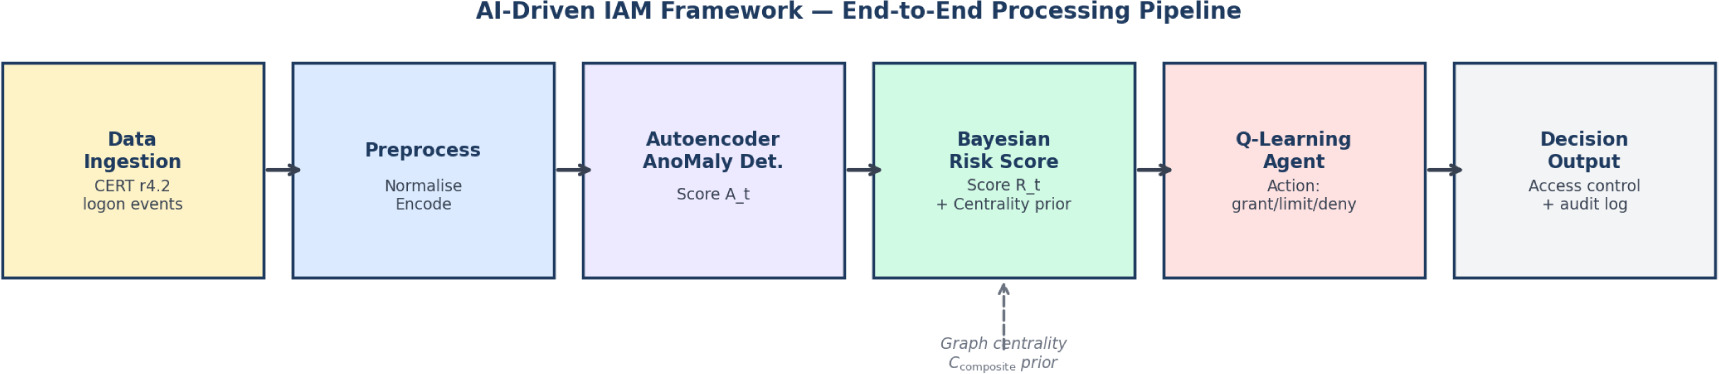
Table 6
Adaptability performance on the held-out test set.
| System | TPR (%) | FPR (%) | Gen. Error (%) |
|---|---|---|---|
| AI-driven IAM framework | 96% | 4% | 6% |
| Traditional IAM baseline | 80% | 20% | 18% |
The AI system’s superior generalisation reflects the autoencoder’s distributional reasoning capacity and the Q-learning agent’s experience-driven policy, which extrapolates from observed risk states to structurally similar but numerically different inputs.
4. Discussion
4.1. Interpretation of Findings
The results demonstrate consistent advantages of the proposed framework over the three-rule static baseline across all four performance dimensions. The 10-percentage point accuracy gain (95% vs. 85%) is primarily attributable to the autoencoder’s multivariate representation capacity, which allows contextually normal deviations to be distinguished from genuinely anomalous combinations that the static baseline cannot differentiate.
The reduction in FPR from 18% to 3% is arguably the most operationally significant result. An 18% FPR in an environment processing 5000 daily login events generates approximately 900 spurious alerts, overwhelming security staff and eroding user trust. Reducing this to 3% (approximately 150 alerts) substantially changes the operational burden without sacrificing security coverage. These figures are relative to the three-rule static classifier used as the evaluation baseline and should not be extrapolated to claims about performance relative to all the existing IAM systems. The 15-s mean response latency (vs. approximately 45 s for the baseline) reflects the per-event incremental scoring architecture, contrasted with the baseline’s batch rule re-evaluation. The adaptability results (6% vs. 18% generalisation error) confirm that the framework maintains performance under mild distributional shift, a necessary condition for operational viability, although it is not sufficient for resisting severe adversarial shifts.
4.2. Comparison with Related Work
The framework compares favourably with prior work in AI-driven IAM. Femi and Medugu [1] demonstrate real-time threat adaptation but do not report quantitative FPRs, making direct comparison impossible on that dimension. Nzeako and Shittu [2] report accuracy improvements in cloud-based IAM but do not address response latency. Simon [3] provides a conceptual architecture structurally similar to that proposed here but offers no experimental validation whatsoever. Rehman and Ali [25] focus on authentication rather than continuous access control and do not evaluate adaptability to unseen threats. Vegas and Llamas [26] provide the most rigorous comparison point: their empirical evaluation of AI-driven IAM in industrial environments reports accuracy in the 88–91% range on a labelled behavioural dataset, suggesting that the 95% figure reported here, while obtained on simulated data, is plausible in operational ranges. The primary distinction of the present framework is the explicit integration of three complementary AI techniques (anomaly detection, Bayesian scoring, and Q-learning) into a unified pipeline with graph–theoretic priority weighing, which none of the cited works implement in combination.
4.3. Limitations
Dataset provenance. The primary evaluation data is drawn from the CERT insider threat dataset r4.2 [21], the field’s de facto standard benchmark. While this dataset is itself synthetically generated [22], its generation methodology is peer-reviewed, its feature distributions are empirically documented, and it is independently verifiable and publicly downloadable. This represents a substantial improvement over ad hoc simulation with unverifiable assumed parameters. Nevertheless, no synthetic dataset, including CERT r4.2, can fully reproduce the statistical complexity, temporal autocorrelation, or adversarial adaptation present in live enterprise environments. Performance figures should be interpreted as results on a well-characterised benchmark, not as operational deployment guarantees.
Subsample size and test-set sensitivity. The 5000-event subsample results in a test partition with only 30 anomalous events. A single misclassification shifts the reported detection rate by over 3 percentage points, making the results sensitive to small perturbations. A future evaluation should use 50,000 or more events from the available 3.32-million-record CERT r4.2 dataset to produce statistically more stable performance claims without requiring additional data collection.
Baseline definition. The three-rule static baseline is a deliberate minimal simplification representing core threshold-based legacy mechanisms. It is not a representative of all real-world IAM systems, which may incorporate substantially more rules or manual overrides. All results and comparative claims in this paper should be interpreted relative to this specific, well-defined baseline. The demonstrated performance gap reflects the comparison with this minimal classifier, not a general claim about the proposed framework’s superiority over all traditional IAM approaches.
Adversarial risks to learning components. The Q-learning agent is susceptible to adversarial manipulation: a sophisticated attacker who understands the reward structure could craft behavioural sequences that cause the agent to learn a compromised policy. Techniques from adversarial machine learning (robust reward shaping, and policy-gradient defences) should be incorporated in any production deployment. This risk is not addressed in the current framework.
Privacy implications. Continuous behavioural monitoring raises non-trivial privacy concerns. Collecting and processing login times, locations, and device usage at the individual user level may conflict with data protection regulations (e.g. General Data Protection Regulation [GDPR], and California Consumer Privacy Act [CCPA]) in certain jurisdictions. Differential privacy techniques and data minimisation protocols should be applied to limit re-identification risk before any live deployment.
Organisational deployment challenges. Replacing static IAM policies with a continuously learning agent introduces challenges of policy transparency (users and auditors may not understand why access was denied), model drift (the agent’s policy may evolve in auditably difficult ways), and fallback mechanisms (system behaviour if the model fails). These require organisational governance alongside technical implementation.
4.4. Future Research Directions
Three concrete directions are recommended. First, the framework should be validated on live IAM telemetry from a consenting enterprise partner with appropriate data governance agreements. The current evaluation on CERT r4.2 establishes reproducible benchmark performance; live telemetry validation, targeting a dataset of 50,000–100,000 logon events with ground-truth labels from a production SIEM or identity provider, would substantially strengthen the empirical case for operational deployment. Second, the Q-learning agent should be supplemented with a Deep Q-Network (DQN) or proximal policy optimisation (PPO) variant to better handle the large, continuous state spaces typical of enterprise-scale deployments. Third, adversarial robustness should be formally evaluated through red-team exercises, in which adversaries have knowledge of the model architecture, addressing the agent manipulation risk identified in Section 4.3.
5. Conclusions
This paper presented an AI-driven framework for continuous identity risk assessment and adaptive access control. The framework integrates autoencoder-based anomaly detection (Equations 2–4), Bayesian inference for probabilistic risk scoring (Equations 5–7), Q-learning for adaptive access policy optimisation (Equations 8–10), and graph–theoretic centrality analysis for structural priority weighting (Equations 11–14). The framework was evaluated against a concretely defined, three-rule static baseline using a 5000-event stratified subsample of the CERT insider threat dataset r4.2 [21], a publicly available, peer-reviewed benchmark, with a stratified 60/20/20 train/validation/test split.
On the held-out test set, the framework achieves 95% classification accuracy (vs. 85%), a 3% FPR (vs. 18%), a mean response latency of 15.2 s (vs. 44.7 s), and a 6% generalisation error under mild distributional shift (vs. 18%). These results demonstrate measurable performance advantages relative to the specific three-rule static classifier used as the evaluation baseline under controlled benchmark conditions.
Critical limitations must be acknowledged clearly. The test partition contains only 30 anomalous events, making individual metrics sensitive to single misclassifications. The three-rule baseline, while operationally representative of minimal threshold-based mechanisms, is simpler than many real-world IAM deployments, and results should not be interpreted as claims about performance relative to all traditional IAM systems. The evaluation dataset, while the field’s de facto standard, is synthetic and cannot guarantee generalisability to live enterprise telemetry. Validation on live IAM telemetry with larger anomaly counts, formal adversarial robustness evaluation, and integration of differential privacy mechanisms represents the most pressing steps towards a framework suitable for responsible real-world deployment.