1. Introduction
The realm of cybersecurity does not only consist of data, computers, routers, and other devices. An endpoint user is one of the basic elements, layers more precisely, as well. A cyberattack typically needs an attack vector, a way to compromise a target system. In most cases, it is the very human error (e.g. incited by phishing) that enables a breach. A user is thus perceived as the weakest link in the cyber structure [1, 2]. Therefore, it is only logical that a specialized branch of cybersecurity research is devoted to the understanding of human roles and behaviour in cyberspace. This quickly growing branch is called cybersecurity behavioural research, it consists of more than five hundred academic publications [2]. This paper aims to be one of them as it investigates the willingness of endpoint users to protect themselves based on the possible impact of various cyber threats.
However large and significant the cybersecurity field has become over recent decades, the general public, including public officials, can often find it challenging to navigate and understand. Therefore, this study comes with a standardized comparison with the physical world and its threats that are more understandable for individuals in our sample. The comparison represents a unique attempt. Hence, robust methodological sections are exhaustively laid out later in the study so the research can be easily replicated. It can also provide a useful benchmark for both readers of this study and participants in the survey described below. This feature creates an obvious obstacle in any case. How to compare such different realms?
The main research question is: how are Czech endpoint users willing to protect themselves against cyber threats and physical threats? As is later explained, the whole study leans towards inductivist logic; hence the secondary goals include a thorough investigation of relationships between examined variables and a detailed description of the methodological process. Emphasis is laid here on the cyber-physical comparison in order to provide a functional framework for possible replication. Given the emerging implementation of measures by a state aimed at securing its citizens (discussed in the next section) another inquiry arises as well: are such measures justifiable by a clear need of citizens?
1.1. The State and its Citizens in Cyberspace: A Need for Research
The scope and motivation of this study significantly overlap with the concept of “secured citizens, secured state”. When present in vast numbers insufficiently secured users and their devices can pose a threat to public administration and critical infrastructure in the form of pivoting attacks or the bring-your-own-device (BYOD) phenomenon. States have hence begun to bring this topic to public debate in various forms and intensities. For example, from January 2020 California banned the usage of default and hard-coded passwords in all devices that are to be sold in this Silicon Valley state [3]. Weakly secured electronic devices are widely used in botnet attacks as well as other forms of attack. The aforementioned law is thus aimed at reducing this type of threat [4]. A less coercive tool was created in Israel – a hotline that businesses and private individuals can contact if they suspect they are victims of a cyberattack [5]. Both cases illustrate an endeavour from the state to more or less incorporate its citizens into cybersecurity processes.
It has already been mentioned that quite a lot of research is devoted to human behaviour connected with cyberspace and cybersecurity. Inadequate academic attention is, however, dedicated to understanding the willingness of users to protect themselves against various online threats. Such an understanding could serve as a knowledge base for public authorities to design effective measures to protect their citizens. Efforts like the Californian law are emerging to protect citizens in cyberspace, and consequently to protect the state itself, but recipients of such measures have not been adequately understood. This is an application of imperfect means utterly preventable with proper research. A better understanding of the endpoint user’s willingness to protect him or herself could increase the efficiency of the whole process as a state can invest in areas where users are not willing to invest themselves and vice versa. Another purpose of this paper is to open a discussion on this topic and to provide a stepping stone for further research.
1.2. Relevant Academic Context
Even though cybersecurity behavioural research is quite a large field with hundreds of academic papers [2], the comparison between cyber and physical threats or dimensions is unique. This is especially so in the prism of the state actor and security research. We employed a relatively structured approach in identifying the relevant literature. The SCOPUS database was searched using the keywords “willingness” and “cybersecurity”, resulting in 42 papers and 112 articles for the search string “cyber AND comparison AND threat AND physical OR real”. All abstracts were then close-read and assessed for their relevance to our research.
Most researchers devote their attention to either of these two realms, i.e. [6, 7]. The latter paper measured the willingness of individuals to pay and adopt cybersecurity training on a Swedish-based sample and how this was affected by worry about various cyber threats. They found no correlation whatsoever between these two variables.
Thematically close is the paper authored by Furman et al. [8], which examines users’ perception and knowledge of cyber threats through an interview conducted with 40 participants (most of them with college education). The paper states that most participants rely on third parties to provide them with online security (e.g. state, software companies, and banks). A large portion (44%) of them are not able to generally define the most common cyber threats, such as phishing, keylogger, botnet or spyware [8]. Both these insights are valuable for us as the first one justifies an increase in the state’s interest in the cybersecurity of its citizens, and the latter supports the usefulness of comparison between cyber and physical realms.
Bauman & Newman’s [9] study lays down a foundation for our cyber and physical domain comparison. In this study the authors juxtapose cyberbullying and its classical form. The sample of 588 students was presented with a survey measuring the perception of manifestations of both types of bullying. In other words, the impact of various threats were used to measure very incomparable domains. This is a crucial intake of Bauman & Newman’s article [9] as a similar approach is used in this study.
Similar to our conceptualization of the willingness of endpoint users to protect themselves is a study by Fagan & Khan [10] on perception in a user’s decision- making process concerning the costs and benefits calculation. Their article examines the motivation of users to ignore cybersecurity advice. Assuming a user’s rationality, they presume that a user’s decision is the result of the endeavour to maximize benefits and minimize costs. After analyzing 12 combinations of motivators of benefits, risks, and costs along with the individual and societal dimensions, they conclude that a benefit is a crucial motivator if the user associates that benefit with an action [10].
2. Methods and limits
The data in this study mainly comes from an online survey which was conducted in the Czech Republic. There are limitations inherent to this source, these methods and to the tools used, they are introduced to meet the transparency criterion of the scientific method. The general approach to the survey-creating process was taken from an article by Schaeffer & Presser [11] which lists the possible, mostly respondent- related errors and cognitive biases as well as how to avoid them. In addition, the survey-creating process also incorporates the three-rule approach from Bourke, Kirby and Doran [12] which states that a respondent must both understand the question and be willing and capable of answering it.
The sample that came out of the survey consists of 247 participants, 96 (38.9%) men and 151 (61.1%) women. As regards education, most of the participants (51.4%) had a college degree (one had another form of higher education), 26.7% had a high school education, and 21.9% had only primary education. As the survey works closely with the economic situation of participants, it is essential to mention that 66.4% were students, and 31.5% were economically active (employed or self-employed).
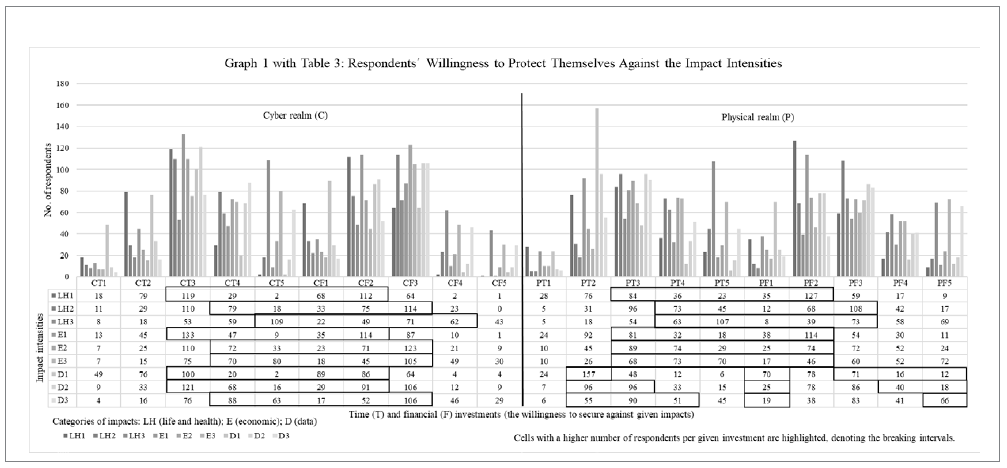
The survey’s intersections of axes X and Y resulted in 36 main-body questions which produced 90 values per matrix (Tab. 3.). These values provided information about the willingness of endpoint users to protect themselves from various impact intensities. Five questions were used to measure the basic cybersecurity knowledge of respondents, this provided a cybersecurity score variable (max. value was 7, median 5, and mean 5.24) and another five questions measured socioeconomic status based on monthly income. The mean value of the income variable was 23 730 CZK (approx. 860 EUR), and the median was 15 000 CZK (approx. 545 EUR). Although approx. 25% of respondents refused to share their monthly income. The rest of the variables measured willingness to protect themselves against various cyber and physical threats.
Such a sample is not representative, i.e. we cannot infer conclusions based on the sample data to the whole intended population. This is the most substantial limit of the study. Nevertheless, let us reiterate its purpose, which is to provide a premier comparison and insight into developing a state-citizen relationship in cyberspace research. Hence, if viewed through an inductivist prism, the study can still bring valuable benefits to the field of cybersecurity behavioural research, despite the unrepresentative sample.
2.1. A Comparison of Cyber and Physical Domains
One of the key features in the survey-making process is standardization, this increases reliability. Every respondent has to receive the same set of questions, which have to be processed and analyzed the same way throughout the process, so that interviewer error is minimized [13]. The same principle logically applies to the comparison of two sets of questions (cyber and physical). But how to transpose theory into this study’s practice? Two hindrances must be overcome.
In section 1.2 the Bauman & Newman [9] article was briefly introduced, it offers a potential solution to the comparison question. The perception of cyber and classical bullying was measured by the impact of their manifestations which provides a rather useful and straightforward approach for comparison of phenomena which are different. The method of Bauman & Newman [9] is designed for concrete threats and their manifestations. However, the aim of our study is more general as it takes into consideration all possible threats. Therefore, the method must be altered to fit here. That brings us to the second hindrance to be solved for the comparison to work correctly.
There is no reasonable way to incorporate every single cyber and physical threat and to compare all of them in a standardized manner to achieve the desired results. One of the authors faced a similar issue with the quantitative risk assessment of eGovernment in the Czech Republic [14]. Inspired by the Czech National Cyber and Information Security Agency (NÚKIB, former National Centre for Cyber Security) a matrix and interval approach was implemented based upon their conduct in such analysis. Instead of a particular description of each of the countless threats that would later enter an analysis, a broader interval form allowed us to classify them into categories which enter the analysis as entities in manageable quantity.
To summarise, this study uses the approach of Bauman & Newman [9] to make the difficult comparison between physical and cyber threats through their impacts, with intervals to reduce numerous cyber and physical threats into categories. The matrix then serves as a way to arrange the data for comparison.
2.1.2. Conceptualization of key terms
Now that the central assumptions are set and clear, we can move to the conceptualization of key phenomena. Zeman defines a threat as a “primary, independently existing phenomenon, which can or wants to damage a concrete value”[15]. A dualist division of intentional and unintentional threats stems from this definition. To reasonably reduce the research subject, only intentional (e.g. perpetrated by a human being) threats are taken into consideration here.
A cyber threat is simply defined as “anything that has the potential to cause serious harm to a computer system” [16]. A “physical” threat does not represent a potent term in the field of political science. However, it plays a role in jurisprudence. In order not to encroach on the field of law, as this paper concerns political science, the study combines Zeman’s [15] definition of threat with the concept of “physical”, which is “anything that has a material existence: perceptible especially through the senses and subject to the laws of nature” [17].
The willingness of endpoint users to protect themselves is not a generally used or accepted term either. Hence, it needs to be conceptualized indirectly, as well. Zeman’s [15] equation of risk (risk = the multiplication of threat, vulnerability, and value divided by countermeasures) can be helpful here. The willingness to protect oneself is de facto the willingness to apply countermeasures. While assuming rationality, it is a calculation of costs and benefits. The latter represents here the absence of damaging impacts. The willingness to protect oneself can thus be perceived as a propensity to invest in something trying to prevent a threat from happening. There are several forces in place that largely influence the essence of that “something”. The survey must be kept brief to increase the response rate. It must also be comparable across both cyber and physical realms and easily imaginable for respondents. Hence, the study works with two concepts of investment: financial and time. To anchor it more in theory, Zeman [15] interlinks financial investment with countermeasures as well. The time component was added to reflect the nature of the cyber domain better as there are a vast number of countermeasures that require time rather than a direct financial investment, such as the invention of strong passwords or learning how to conduct cyber hygiene properly.
Similarly, complicated conceptualization is tied to impacts. This study takes inspiration from the approach of the NÚKIB, which lists threat impacts on life and health, economics and finance, reputation and the upholding of laws and regulations [14]. Unlike NÚKIB, this analysis focuses on an individual level, not on the state level of critical infrastructure. The cyber-physical comparison must be kept in mind as well. Therefore, the common intersection here takes the form of three categories of impact on an individual’s life and health, economics and data.
2.1.3. Matrices and operationalization
To elaborate more on the research question, the primary goal of the study was to measure the willingness of endpoint users to protect themselves (a dependent variable) based on their perception of threats represented by their impacts (an independent variable). Hence, a matrix consisting of two axes, one for each variable, is a fitting and clear way to structure the data. As there is a need for the comparison of physical and cyber domains in a standardized way, two standardized matrices are used.
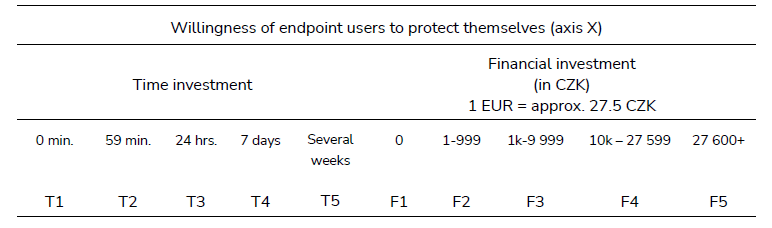
Variables need to be operationalized for the measurement to be possible. Cox suggests that a respondent should be offered five to nine options to choose from [18]. Nevertheless, there is another caveat in place stating that the longer the survey, the lesser the response rate. Hence, five categories of both time and financial investments are offered in survey questions measuring the willingness of the endpoint users. This variable lies on axis X (see Tab. 1.).
The investment categories need to be exhaustive so that each respondent can fit in one of them. Here are the intervals. Time investments are equally divided as follows:
0 minutes (no investment at all)<1min.; 59min.><1hr.; 24hrs.><24hrs.; 7 days>7 days or more denoted as ‘several weeks’
The financial investments are based on the median pay in the Czech Republic, which is 27 6001 CZK [19], so the respondents can easily relate to the given answers. The stratification of values was adjusted due to feedback from the focus group pilot testing:
0 CZK (no investment at all)<1 CZK; 999 CZK><1k CZK; 9 999 CZK><10k CZK; 27 599 CZK>27 600 CZK or more
1 Approx. 1000 EUR.
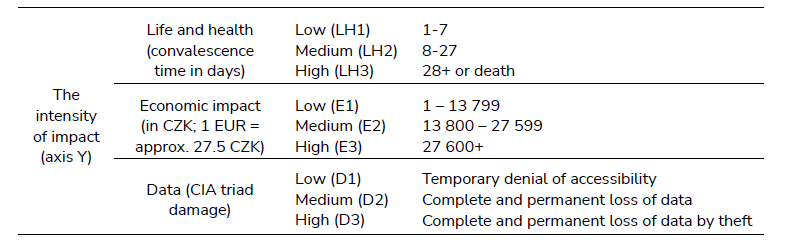
The axis Y of the matrix is left for the independent variable, the impacts of cyber-physical threats. In an operationalized form, it is more specific to refer to them as intensities of impacts. There are three degrees of intensity used to provide a respondent with two extreme and one middle option. If only one more category had been added, the number of questions would have increased by 30 per matrix, which would have significantly threatened the response rate.
As this study is limited to only intentional, hence usually criminal threats, it relies on the Czech Criminal Code [20]. Paragraph 122 defines “serious injury” as “mutilation, loss or substantial reduction in fitness, limb paralysis, loss or substantial impairment of sensory function, damage to an important organ, disfigurement, induction of abortion or killing of the foetus, torturous distress, or prolonged impairment of health” [20]. A time of convalescence is used in the given questions in order to present a relatable and imaginable form to a respondent. At the same time, the ‘high intensity’ option mentions the possibility of death as the ultimate form of an impact. The other two intensities are equally distributed: low <1, 7 days>, medium <8, 27 days> (plus high intensity: 28 days or more plus the possibility of death) (Tab. 2.). The number of days was chosen due to the hypothesis that the numerical form of the operationalized variable reduced the risk of misinterpretation [11], the figures were arrived at in consultation with physicians.
Economic impacts rely heavily on the personal situation of the given respondent. In order to be relatable to as many respondents as possible, the same approach as with the financial investments above is used. Based on the median for pay, which is approx. 27 600 CZK [19], the intervals of three intensities are equally distributed (Tab. 2.).
Regarding the data impact category, the ‘CIA triad’ is used for operationalization. This information security concept can be applied to both the cyber and physical worlds. It stands for Confidentiality, Integrity and Availability of data, it perceives these factors as the desirable and protected values of a reference object, namely data [21]. The CIA concept can apply to a physical world as well. Confidentiality can be compromised by ID card theft, availability by their loss and integrity by the shredding of important documents. The distribution of intensities is intuitive here. High intensity represents the disruption of all three attributes, namely theft and complete and permanent loss of data in any form. Medium intensity is the complete and permanent loss of data (without theft), and low intensity takes the form of a temporary denial of accessibility.
2.1.4. Collection of survey data
The intersections of both axes determined the form of questions in the survey. Each category for intensity of impact contained an example of both a cyber threat and a physical threat, this provided as clear and relatable a set of questions as possible for each respondent, thus increasing the validity of the survey. Therefore, the resulting survey consisted of 18 questions for each matrix measuring the influence of the aforementioned impacts on the willingness of endpoint users to protect themselves. A respondent was offered five options denoting how much they were willing to invest, in either time or money, to mitigate the risk. At the very beginning of the survey respondents were briefed that the more they invested, the more the risk decreased. Although an oversimplification, this narrative of linearity was intended to make answering the questions easier while measuring the influence of intensity of impacts on willingness.
Each of the 36 main-body questions contained possible investments denoted by precise numerical intervals as well as examples of countermeasures that corresponded with given intervals of time and financial investment, e.g. “an online cybersecurity course from 24 hours inclusive to 7 days exclusive”. The first draft of the survey contained only numerical expressions, but specific examples were added due to the results of the focus-group2 pilot testing. The focus-group feedback also mentioned the need for information, especially about cybersecurity and cyber threats, so that participants could make an informed decision upon which type of investment to choose. This could damage the ecological validity, but the focus group’s demand was absolute, so we chose introductions which were as brief as possible to meet this demand whilst minimizing the damage.
The survey also contained five questions on socio-economic standing and five measuring the level of cybersecurity knowledge; the latter stem from Google [22] and UC Berkeley [23] basic security tips. Both entities recommend strong password policies and frequent software updates. Furthermore, they warn about identity theft, spoofing and phishing attacks and recommend a cautious attitude when working with suspicious emails which request sensitive data and access data. Verifying URLs and the need for data backup are mentioned by Google and UC Berkeley as well [22, 23]. The socioeconomic section inquired about a respondent’s age, education, type of employment (tailored for the Czech market), and income. While the first four questions were compulsory, the last one was optional due to its intrusiveness.
The survey was distributed via various social media groups; therefore, the sample is convenient and not representative of the Czech population. However, as the study’s logic is qualitative, we were aiming for theoretical saturation rather than costly statistical representativeness, which we achieved as shown in Tab. 3.
3. Data analysis
The results were statistically analyzed using IBM’s SPSS software ver. 25. The assessment of the data centrality (means and medians) for respondents is laid down in section 2.1, describing the sample. Despite histograms with promising skewness and kurtosis, none of the variables had normal distribution according to the Kolgomorov-Smirnov test, which allows for only robust further statistical testing.
3.1. Basic descriptives
We started the analysis with frequencies (Tab. 3.) and by looking for relationships in socioeconomic and cybersecurity-knowledge variables. In most cases relationships were either not statistically or factually significant. Only gender correlated weakly (0.187) with cybersecurity score (p < .01). Crosstab results then revealed more men in the higher echelons (cybersecurity score 6 and 7) than women, meaning that men tend to be slightly more knowledgeable and cautious in cyberspace than women.
Crosstabs were also used for examination of the willingness of individuals to protect themselves. The risk of cyber threats having an impact on human life or health was shallow [24]. Despite the real-world probabilities, respondents were eager to put the biggest time and financial investments in countermeasures against the life or health threats compared to the other two categories (economic and data) of impacts. That is, nevertheless, only a logical and anticipated conclusion. On the other hand, a threat to life and health can more easily and probably occur in the physical realm. The highest forms of investments were, in the physical matrix, concentrated more on the economic impacts than in the life or health categories. This suggests that respondents were more afraid of fraud and theft than violent crime. That would be a surprising finding if not for the fact that the Czech Republic is one of the safest countries in the world [25].
A more interesting observation appears if we compare time and financial investments for each of the intensities of impact then graphically differentiate that which has the higher frequency of answers (Tab. 3.). This produces something called “the breaking interval” which denotes a threshold after which individuals, on average, are more likely to invest time than money or vice versa. The breaking interval, e.g. low intensity of impact on life and health in the cyber aspect of the matrix, is <1 CZK; 999 CZK>. Higher investments, in this case, are preferable in the form of spending time rather than money. If the intensity in the same impact category rises to the medium level, the breaking interval shifts to <1 000 CZK; 9 999 CZK>. The identification of the breaking interval could, for example, serve for the creation of tailor-made cybersecurity education, subsidized anti-virus software subscription or other measures made by a state for its citizens.
3.2. Cyber-physical comparison
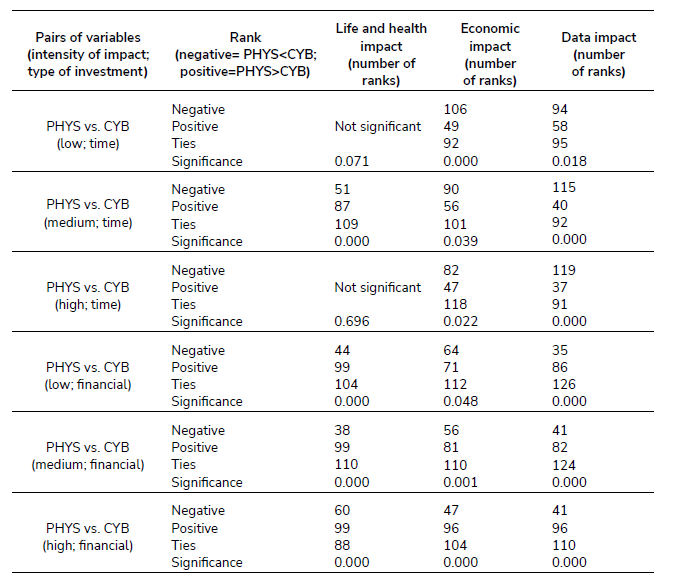
The frequencies contained in Tab. 3. are self-explanatory, so let us move to the trickier comparison of the cyber and physical worlds. As none of the survey variables is normally distributed, non-parametric testing had to be done. Using the Wilcoxon signed-rank test, we compared pairs (one for cyber and one for the physical realm) for a given investment type intersected with the intensity of the given impact. The test then returned significance and the number of positive ranks (number of respondents willing to invest more) and negative ranks (number of respondents willing to invest less) for each pair.
All of the pair comparisons were significant (Tab. 4.), except for the willingness to invest time against cyber and physical threats with low and high intensities of impact on human life and health (hence, these two were crossed out from the table). Before the results are examined, it is essential to reiterate that respondents scored relatively highly in the basic cybersecurity knowledge test (mean 5.24; median 5; max. value 7). Could this have had any significant impact on the results?
We argue that it very likely could not. Using the Mann-Whitney test, which examines the differences between two conditions and between two different groups (this is called ‘the grouping variable’), we found that none of the variables we used for grouping – cybersecurity score, age, income and education in their recoded dichotomous form - had any significant effect on the two test variables of the given willingness and impact intensity intersections for either the cyber or physical realm (e.g. willingness to invest zero time to prevent the low intensity of the impact of a cyber or physical threat). In other words, the level of cybersecurity knowledge or age of a respondent could not explain their willingness to invest more or less in comparable cyber and physical countermeasures.
The results turned out to be quite predictable in the ‘life and health’ category because the general trend reflected the reality quite well, especially in terms of probabilities of threats occurring. This is interesting as the portion of respondents who performed a risk assessment, meaning they did not choose the same investment for both of the realms (Tab. 4.), performed, on average, the assessment well. Life and health threats are rare in the cybersecurity field, unlike in the physical realm [24]. In accordance with this, 87 to 99 respondents (depending on the type of investment and the intensity of impact) were willing to invest more in physical countermeasures. However, the differences between well-assessing and badly-assessing (positive minus negative ranks) individuals were not substantial. Also the numbers of ties were high (around 100), indicating that large portions of people did not assess or properly distinguish between cyber and physical threats. A point of note is that the number of ties is very similar across the comparisons showing the consistency we elaborate on in the discussion.
More mixed and ambiguous trends occurred in the economic category. As regards time investments, there were more negative than positive ranks indicating that more people had been willing to invest more in measures countering cyber threats (the survey mentioned ransomware) than in measures countering physical ones (theft, fraud, and embezzlement). By using worldwide statistics as well as those from the Czech police, Kleiner (2020) argues that in the Czech Republic there are higher frequencies and more severe damage on the side of the mentioned physical threats [24]. In order to cope more with reality, the reported trend should thus have an opposite direction which can be found in financial investments (more positive than negative ranks).
As the life and health tier was chosen to better suit the physical world, the data one was intended dominantly for the cyber realm. The survey mainly emphasized email, internet banking, identity theft, and similarly ID cards, passports, sensitive documents, stalking and other forms of surveillance and intrusion. Trends here are very similar to the economic impacts category. As the Czech police statistics are not sufficiently detailed, it is hard to conclude if the trend is following reality [26]. Cyberattacks aimed at obtaining personal data are rampant and extensive on a global scale [27]. We should, therefore, see much more negative than positive ranks in the last column of Tab. 4. However, that only applies to the time investments which leaves those in the financial categories significantly underinvested.
4. Conclusion
The survey data and results are based on an unrepresentative sample so therefore need to be revisited with further research. Nevertheless, the general framework was set to be inductivist; hence some valuable insights still came up. The methodological process, which is both unique and built on previous research, proved to be further replicable as there are significant differences among various impact intensities and cyber and physical matrices. While examining the distribution of frequencies an exciting phenomenon we call “the breaking intervals” emerged. They represent a threshold beyond which individuals are, on average, willing to invest time rather than money or vice versa. Relationships among collected variables are what remains of secondary goals to be addressed here. We found that men are slightly more knowledgeable or cautious when it comes to cybersecurity. At the same time we could not find any statistically significant effect of gender, age, education, income or knowledge of cybersecurity basics on the difference between willingness to invest in measures against cyber threats and their physical counterparts.
In terms of the cyber-physical comparison, besides frequencies in Table. 3. with self-explicable results, the focus was on how individuals are willing to invest time or money in measures against cyber and physical threats that are represented by their impact, so are hence comparable. We were also interested in the change between those two conditions (cyber and physical), be it negative, positive or be it a tie. This change of willingness indicates to which threat impact respondents attach more weight. Results were also put in the context of threat analysis undertaken by Jan Kleiner [24].
In the life and health category, on average respondents tended to invest more in physical countermeasures than in cyber ones. That is in accordance with real- world risks. The data category was set to counterbalance the more physical-dominant life and health category, so we had expected an apparent inclination to invest more in cyber countermeasures (e.g. reading cybersecurity tips or books, creating a firm password policy, buying an anti-virus licence) against threats like data and identity theft that are currently on the rise [27]. The trend did not follow our expectations. Individuals were willing to invest more time against cyber than physical threats. However, the financial investments were much higher on the side of physical threats like theft of an ID card or sensitive document. Despite the massive amount of ransomware and other financial attacks all over the world, there are physical, and financial threats such as theft, fraud or embezzlement prevalent in the Czech Republic [26], but the respondents were willing to invest more in countering cyber threats, even though they occur less frequently.
Such conclusions are valuable on their own as they can serve as a background for states to more efficiently protect their citizens in cyberspace. Moreover, if we combine the conclusions together, we get a picture, although an incomplete one, of the pungent issue. Individuals from our sample, which is made mostly of higher-educated individuals, are not sufficiently equipped to assess cyber threats on their own. State involvement is thus desirable. It becomes necessary when the logic “a state is only as secure as its citizens” is applied here. Whether there is a call for this is another question requiring further research.
5. Discussion
Our study can serve as a source of valuable information for a state upon which concrete measures can be built. Concretely, encouragements or incentives can be implemented where the willingness is low and savings where it is high. Other efforts like original research, or replication of our study (with the mitigation its limits) should be made to understand better the recipients of today’s and future state’s cybersecurity solutions to ensure effectiveness. We see three priorities that arose while conducting our study: a deeper investigation into the “breaking intervals”, a deeper investigation into the number of ties, and finding the statistically significant grouping variables which explain the shift between the cyber and physical values of investment.
Despite the significant differences among variables mentioned in the conclusion, the number of ties in the signed-rank test, i.e. people who chose the same investment for the cyber and physical reality, took on values around 100 in all cases. This indicates the lack of contemplation, general knowledge about cyber threats and their risks, or the shortage of physical vs cyber recognition. It could also be caused by an effort to undertake the survey as quickly as possible while ‘satisficing’, a term used by Schaeffer & Presser [11], the researchers. On the other hand, we do not think that chaotic and meaningless answers can explain the high number of ties as they are a sign of consistency. Chaotic answers would vary much more. It must also be emphasized that “the breaking intervals” are probably closely tied with the sample, or rather its average income and socioeconomic status, how closely, we simply do not know, and it makes “the breaking intervals” another interesting and valuable topic worthy of academic pursuit.
It is also worth viewing our results (with all their limitations in mind) in light of the Kävrestad et al. [7] paper, which concluded that the threat itself might not be the predictor for users’ willingness to pay for cybersecurity training as those two variables did not correlate. Our results might suggest the possible explanation of impacts being one of the variables of interest for such studies.
Finally, there are also implications for the practical conduct of a security policy. It has roots in nudge theory as streamlined by Thaler & Sunstein [28] and which concerns, among other things, how to best alter the governance and administrative process so they have the desired effect on citizens. Our results and those of Käverstand’s et al. [7] suggest that in communication with citizens, a government should emphasize the impact of cyber threats, not the cyber threats themselves. A possible and established reason for this could be the longstanding lack of cybersecurity knowledge possessed by the average person [29].

